Assessment of Market Readiness and Technology Readiness Levels (MTRL in short) is a fundamental step in the value chain that all projects need to keep track of. Based on regular MTRL self-assessments, projects can track their relative project progress with other projects in the field. This is reported in the radar providing a status update to policy makers and potential users.
With 9 simple questions, projects receive a standardised feedback on their progress as well as an indication of weak points to focus on. Questions focus on maturity related topics such as the project’s maturity, product design and development, the competitive landscape, the team behind the work, accompanying documentation and IP management. Go to market strategy and supply chain are also considered.
For a full overview of the methodology behind the MTRL scoring, see our report, which provides a comprehensive overview of MRL and TRL ranking and how results from the self-assessment data collected is analysed for the purposes of the radar.
Project readiness is visualised using an extended traffic-light pattern as follows:
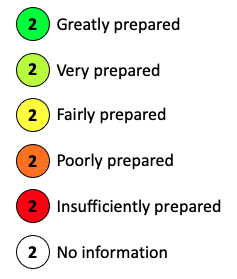
This colour coding allows project managers and policy makers to quickly visualise which cybersecurity sub-domains are more advanced both in the technological and marketing sense, and which specific projects are leading each category.
Whenever a project coordinator submits new MTRL values, a weighed score is calculated as:
Score = 7 x MRL + 2 x TRL
You can see the respective MRL and TRL values in the project's information card in the "Relative performance" section.
But where's the score, and what's this "relative performance"?
To put a project's MTRL score into context (i.e., with other projects), scores of all projects in the same segment and same ring are collected. From these, the following key values are calculated:
- Lowest score;
- Median score; and
- Highest score.
With that, we can normalise a project score as its Relative Performance as the difference between score and median score:
Relative performance = MTRL score - Median score
The colour scale is applied by dividing the difference between min and max score into five equal intervals with an associated colour gradient, and kept as a lookup table.
To determine which colour to use for the project blip, the Project Radar simplyqueries the gradient lookup table.